Infographics

Infographic: Could gut bacteria help us diagnose and treat diseases? This is on the horizon thanks to CRISPR gene editing
Humans are never alone. Even in a room devoid of other people, they are always in the company of billions ...

Are pesticide residues on food something to worry about?
Just like anything that goes into your body, it’s the dose (the amount) that matters ...

Pesticides and Food: It’s not a black or white issue — Has pesticide use decreased since the introduction of GMO crops?
What is the truth about crop pesticides and their residues in food in 2018? ...

How effective and safe are current-generation pesticides?
it is important to balance risks with the benefits that pesticides provide ...

Pesticides and Food: It’s not a black or white issue — How do organic pesticides compare to synthetic pesticides?
Many consumers choose to buy higher-priced organic produce because they believe organic foods are not grown using pesticides and therefore ...

Pesticides and Food: It’s not a black or white issue — Part 5: Soil health ― When synthetic pesticides are more sustainable than ‘natural’ organics
Most consumers believe organic farming avoids pesticides and prioritizes the health of the environment more than conventional farming. However, this ...

Infographic: Tree of Sex — Cataloging wild ways nature reproduces, from sex-changing fish to asexual lizards
From sex-changing fish to asexual lizards, these and many more species will be captured in a new sex database ...

Infographic: Pathway of human evolution, from protocells to people
[C]over the four stages of earth’s history and how they relate to our species’ development as well as what happened ...

Infographic: Did you know the human body is made up of zinc, copper and cobalt? Here are the chemicals that make up who we are
The human body is a miraculous, well-oiled, and exceptionally complex machine. It requires a multitude of functioning parts to come ...

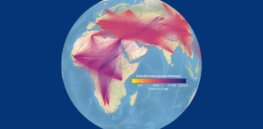
Infographic: Trump-voting Republican counties suffered more than twice the death rate from COVID than Democratic ones
Even with widely available vaccines and newly effective treatments, residents of counties that went heavily for Donald Trump in the ...
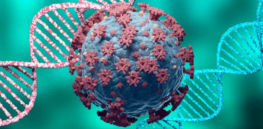
Infographic: Here is how experts think the COVID virus will evolve
As scientists who study how viruses evolve, we are often asked about the future of the coronavirus. Will it go ...
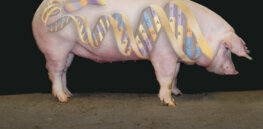
Infographic: Are genetically modified pigs the future of organ transplants?
So how close are we to using pigs for a limitless supply of organs to solve the global shortage? Using ...
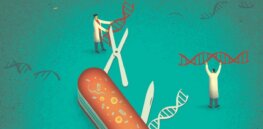
Infographic: Gene editing FAQ
Gene editing is when a scientist makes a tiny, controlled change in the DNA of a seed or animal, including ...
Video and infographic: Most comprehensive family tree ever retraces history of humanity
A new, enormous family tree for all of humanity attempts to summarize how all humans alive today relate both to ...

Infographics: Vaccinated vs. unvaccinated — Death risk differences are startling
Some of the timeliest data on Covid-19 outcomes by vaccination status comes from New York City and the Seattle area, and ...

Infographic: Is Huntington’s an ‘incurable’ brain disease? New gene therapies offer hope
Huntington’s disease (HD) is an inherited condition that causes widespread deterioration in the brain and disrupts thinking, behaviour, emotion and ...

Infographic: When will Omicron peak?
Our models project that the United States is likely to document more Covid-19 cases in January than in any previous ...

Infographic: Unvaccinated people up to 20 times more likely to die of COVID than vaccinated people, California data show
Unvaccinated Californians were between 15 and 20 times more likely to die of COVID-19 than vaccinated ones when deaths from ...

Infographic: What are medical abortions — and how accessible are they?
Medication abortion, also known as medical abortion or abortion with pills, is an FDA approved pregnancy termination protocol that involves ...

Infographic: Scientists under attack for publicly discussing the science on COVID and vaccines
Infectious-diseases physician Krutika Kuppalli had been in her new job for barely a week in September 2020, when someone phoned ...

Infographic: Who are the last COVID vaccine holdouts?
Conservative media sometimes blame the problem of the unvaccinated on people of color, but the data show vaccine resistance is mostly ...
Infographic: US honeybee population reverses declines, shows sharp 8% increase over past decade, documents USDA
Over the last 20 years, the U.S. beekeeping industry has experienced significant changes that have included fluctuating honey bee colony ...
Infographics: Black and Hispanic Americans are closing the COVID vaccination gap
With the continued spread of the more transmissible Delta variant, unvaccinated people remain at increased risk for infection, illness, and ...

Infographic: What should pregnant women know about the COVID shot?
Facing months of conflicting guidance and unanswered questions, it's been hard for pregnant women to decide whether or not to ...
Infographic: ‘There is no clear evidence that differences between organic and conventionally grown foods have any bearing on health’
Yes, there are some differences between organically grown food and food produced using conventional methods, said Siv Kjølsrud Bøhn at ...

Infographics: Key charts illustrate split between vaccinated and unvaccinated America
Three in 10 American adults remain unvaccinated, according to the latest survey from the KFF. But they’re not a monolith ...

Infographic: Autoimmune diseases — 76 identified so far — tend to target women over men. Here is a master list
There are many autoimmune diseases, and taken together they affect as much as 4.5 percent of the world’s population. This ...